The recent sell-off in Global Equity markets
Last week, global equity markets recorded a 10% correction. These sorts of pullbacks are unsettling but not uncommon. In fact, in the last 21 years, global equities have seen such selloffs about once every 2 years.
Typically, these opportunities have often created excellent entry points for markets and have penalised investors for jumping out and missing out on some of the best returns.
In this note we:
- Discuss what has caused the market pullback
- Look at how frequently such pullbacks occur and how they’ve historically been good times to buy
- Discuss what might put the brakes on this sell-off
- Remind ourselves that the underlying fundamentals remain strong:
- Strong corporates
- Resilient consumers
- Cash on the sidelines
- Central Banks with room to cut interest rates
What has caused the market pullback
The sell-off has centered around the US market, notably US technology stocks and smaller US companies.
The former have felt the brunt of high valuations and increased consternation over their planned investment in Artificial Intelligence (“AI”), whilst the latter have been hit by the increased uncertainty brought with President Trump’s trade policy; notably the threat of tariffs.
The US stock market comprises just over 70% of the global stock market. Within the US market, the Magnificent 7 [1] make up a disproportionate weight (these 7 stocks account for c30% of an index of 503 different stocks). Owning a passive allocation to the US stock market has become a very concentrated trade!
While the Magnificent 7 has fallen by just over 20% in GBP terms [2] compared to their highs on 17th December they remain up over 100% over a 2-year period!
Having traded at an aggregate level of 34x 1 year’s forward earnings at end 2024, they are now trading at 25.5x 1 year’s forward earnings.[3]
They are by no means cheap but nor are they eye wateringly expensive given the dominance and quality of their businesses.
Clearly, President Trump’s policies around tariffs have not been helpful here but we’d argue that the sell-off began back on 17th December: before the 18th December Federal Reserve meeting and before the corporate reporting season for US companies.
What changed on 18th December?
At the 18th December Federal Reserve meeting, the US Federal Reserve made their 3rd cut to interest rates of 2024: taking rates down to 4.75%.
Lower interest rates are generally good news for stock markets, right?
Indeed!
However, the US Federal Reserve accompanied the interest rate cut with a change to their future guidance via their “Summary of Economic Projections” (often referred to as the “dot plot” as it’s a series of “dots” with each one representing each Fed official’s projection for short-term interest rates).
The 18th December dot plot projected just 2 interest rate cuts in 2025 whereas the previous iteration (in September) had projected 4 interest rate cuts.
Whilst the 18th December Fed meeting heralded an interest rate cut, it accompanied it with guidance that there’d be less rate cuts in 2025: this made for a headwind for the more expensively valued stocks in the market (such as the Magnificent 7).
What followed next?
January and February saw the US corporate results season and the emergence of a potential low-cost Chinese competitor (DeepSeek).
What were corporate results like?
US 4th quarter corporate results were very strong. In fact, US companies grew their profits by just over 18% (year-over-year). This made for the strongest quarter of profit growth since Q4 2021 and the 6th consecutive quarter of positive profits growth for the US. All good so far.
The Magnificent 7 as a cohort grew their earnings by 30% year-over-year. This is a very good number, but it is not perhaps “Magnificent” and is a step down from the 100% year-on-year earnings growth that they posted back in the 4th quarter of last year (where they reported their Q3 2024 numbers).
Alongside their results, the Magnificent 7 group of companies committed to spending over $300bn this year: with most of that going to develop their Artificial Intelligence capabilities.
This is a vast amount of money at the best of times, but it attracted greater scrutiny given the emergence of a Chinese competitor (DeepSeek) purportedly able to develop similar technologies for a fraction of the cost.
Our view:
The Magnificent 7 are great companies but it does not represent prudent diversification to have such a high concentration in such a small holding of stocks: we have been deploying a diversified approach for our clients.
How frequently do such sell-offs occur and why staying invested (and perhaps deploying cash) could be sensible strategies:
Fairly often! – Roughly once every 2 years.
We looked at data for the global equity market from the end of 2023 until now.
Over the last 21 years of global equity market returns, we’ve had 12 years with intra-year sell-offs of 10% or more. Only 20% of the time has a 10% correction resulted in the market being down at the end of the calendar year (in fact, the average intra-year drawdown over this period is -14%).
Intra-year declines of 10% or more are unsettling but not uncommon for equity markets:
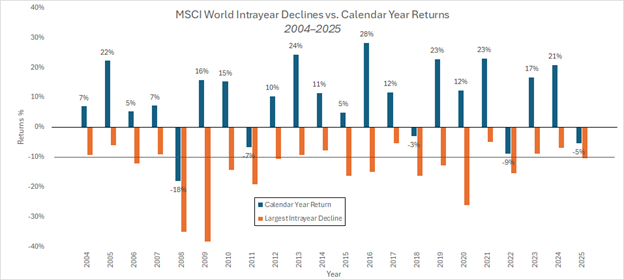
Being invested throughout the whole period would have made for an average annualised return of just shy of 9%.
In our view, staying invested makes sense and trying to time the market can be dangerous!
Good market returns often come just after drawdowns and missing out on those returns can mean missing out on big gains.
Missing just the 30 best days in this time window (about 0.6% of the data set) would have meant sacrificing 2.5% of your annual return: more than 25% of the total return on offer!
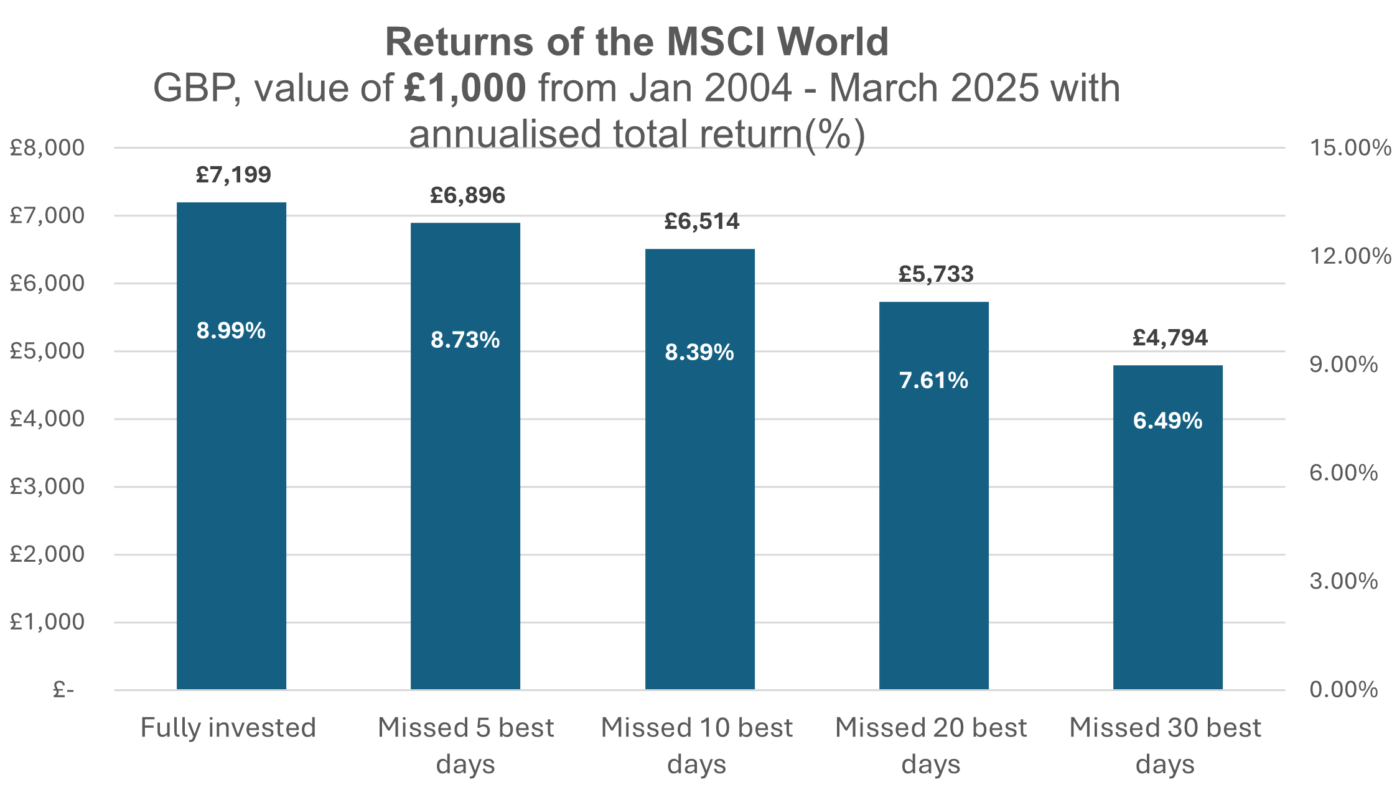
Hence our view that being invested and staying invested makes sense!
What might “Put” the brakes on the sell-off?
A “Put” refers to a floor for stock markets, at which level the sell-off is averted.
A Federal Reserve Put, or a President Trump Put are 2 obvious candidates.
This floor or “Put” can be achieved through:
- lower interest rates / other quantitative measures (in the case of the Fed),
- rhetoric (both) or
- increased spending / lower taxes (in the case of President Trump).
In addition to the Fed Put and the Trump Put, there’s also the not huge cash piles (about $7.2 trillion in US money market funds[4]) on the sides of the US equity markets! We can’t predict when this money will find its way into stock markets, but it will likely do so either by being attracted by lower prices or by being led there by lower interest rates (as interest rates get cut to support growth).
To this last point we’d note that the US market has triggered certain technical indicators [5] which might begin to tempt money back.
A game of chicken between President Trump and the Federal Reserve:
President Trump wants lower interest rates. He takes the view that this will boost growth. Lower interest rates would help consumers and corporates.
Since being inaugurated on 21st January, US borrowing costs have gone down by about 0.25%. For reference, European borrowing costs have risen over this period. Interest rates in the US may not have fallen, but expectations on future interest rates are lower and, importantly, debt service costs are lower.
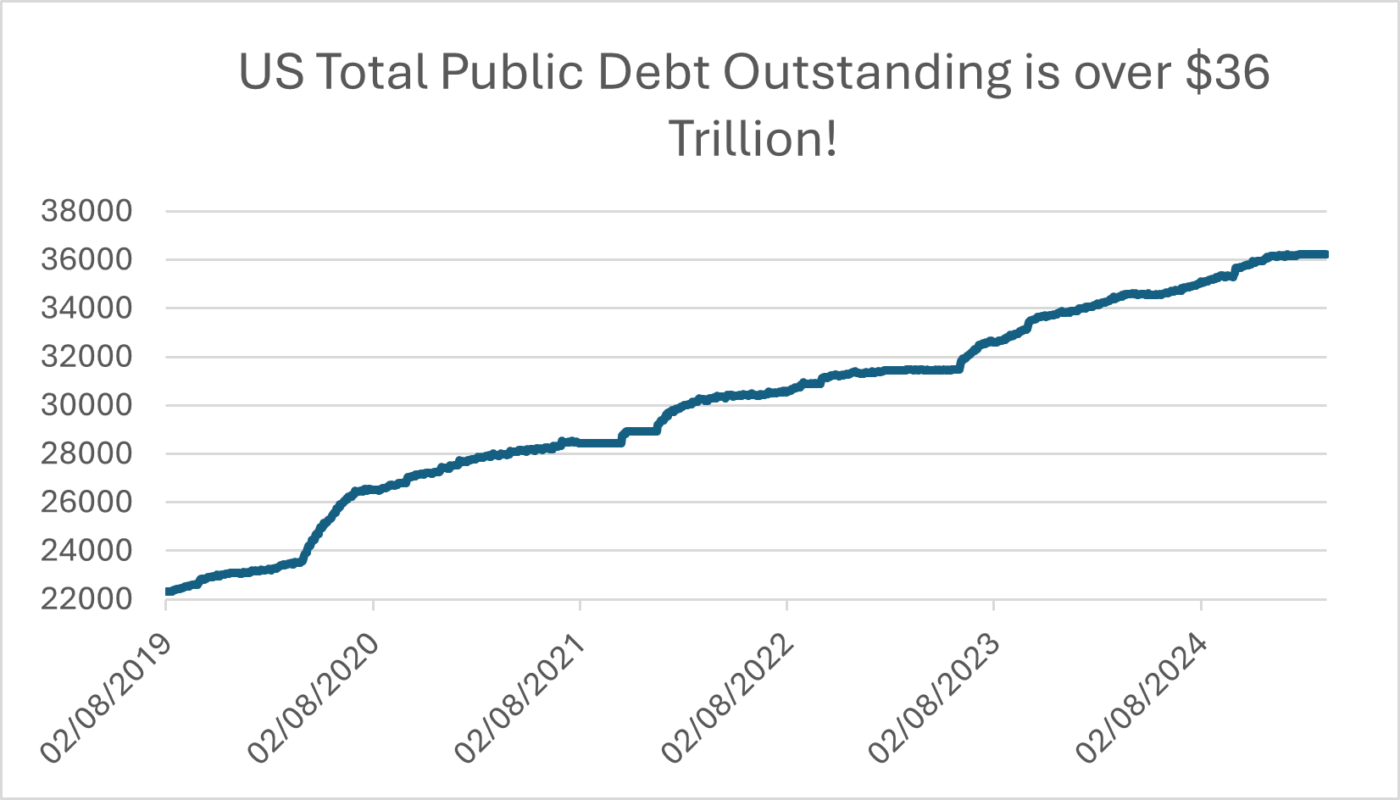
President Trump (and the US Government) have an enormous debt pile to service. Debt levels in the US are just over $36 trillion dollars. To put this into more relatable terms, this is equivalent to 10 towers of Dollar bills stretching from the earth to the moon! A vast amount of money!
With over $36 trillion in debt and debt service payments of close to $1 trillion this year (according to projections from the Congressional Budget Office), lower interest rates are highly desirable.
The US Federal Reserve has 2 mandates: price stability and maximum employment.
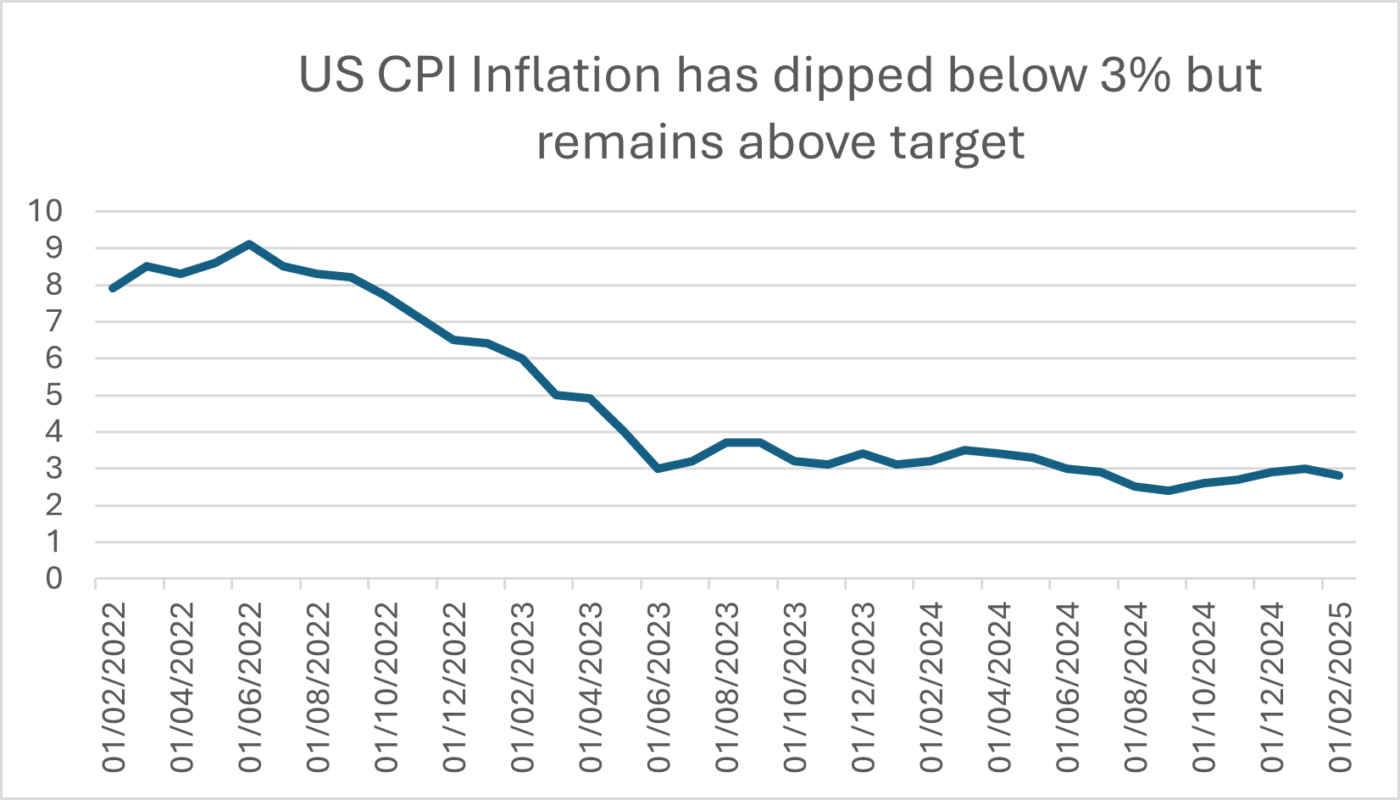
Despite President Trump pledging to “immediately bring prices down” [6], the likelihood is that tariffs will drive prices up: at least in the short-term. The recent inflation numbers [7] came in a bit softer than expected, but they still point to inflation remaining around the 3% mark and this clearly doesn’t pick up the impact of recent tariffs.
The unemployment rate in the US is also low by historical standards. However, it may well start to tick up. The next couple of months’ worth of data will start to reflect the job cuts put through by the Department of Government Efficiency (“DOGE”)
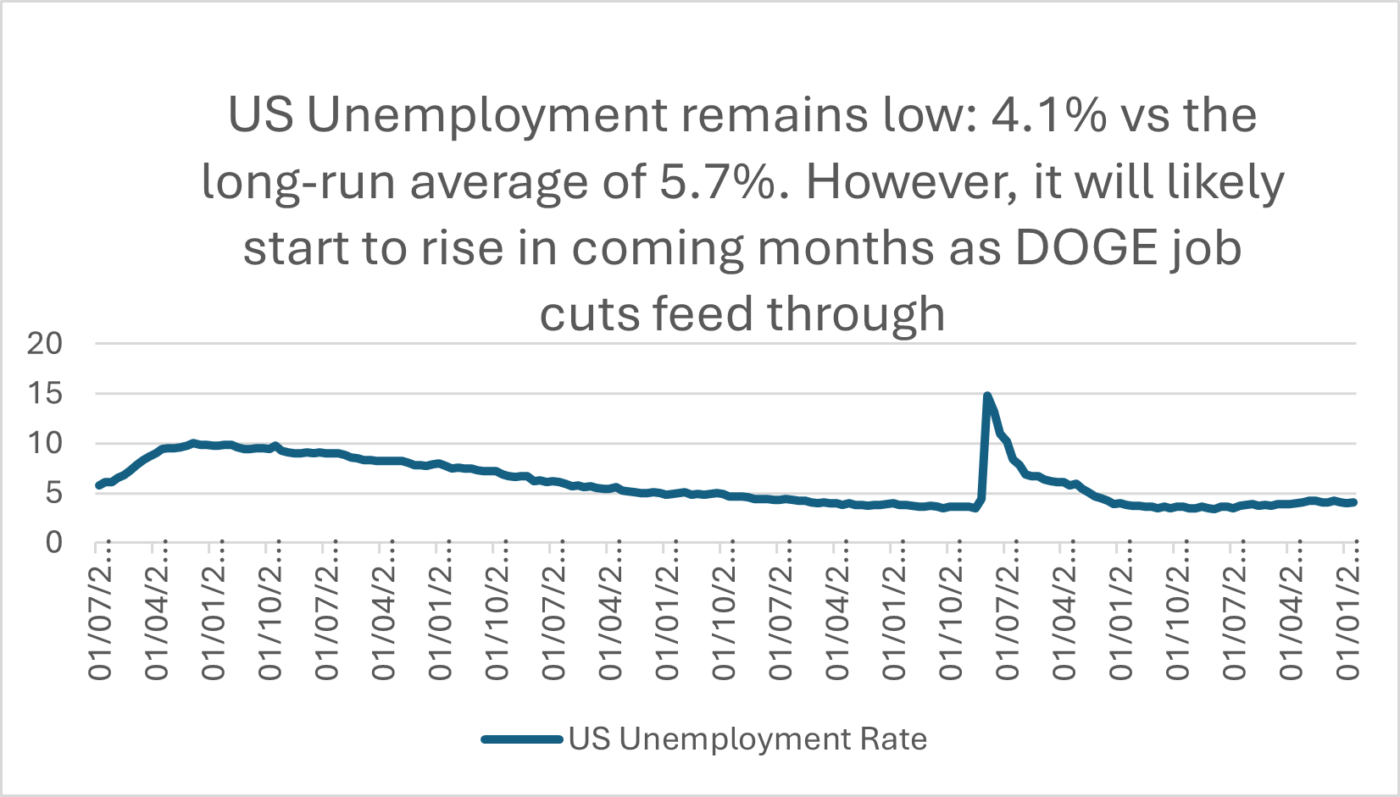
Higher unemployment (through cuts to Government departments) could be the trojan horse that President Trump is looking for as his means to get the Fed to lower interest rates.
It is certainly more subtle than his tactics in the first term where he took to Twitter claiming that Fed Chair Powell had “no guts, no sense, no vision” and that interest rates should be brought “down to zero, or less”.
Buying a new red Tesla won’t boost the stock market (or repair the dent in Elon Musk’s $113 bn drop in wealth so far this year!) [8] in and of itself, but it does show that President Trump has an eye on the stock market.

The dreaded “R” word (“recession”) surfaces in these sorts of pullbacks. Undeniably the economic data in the US has weakened: savings rates have come down; we’re seeing a rise in credit card and auto-loan delinquencies and some measures of consumer confidence have declined. The increased uncertainty associated with the Trump trade policy has likely amplified this.
However, we’d note the following points:
- Credit conditions for companies remain healthy. Credit spreads (i.e. the extra cost that corporates must pay in excess of governments in order to borrow money) remain tight and are significantly lower than their long-run average levels.
- Household debt levels are significantly lower today than at any point in the last 20 years (i.e. households are in a much stronger position that they’ve been previously).
- There’s a whopping $7.2 trillion of cash on the sidelines which can move in to support asset markets
- Central Banks (notably the US Federal Reserve) have room to cut interest rates if they need to in order to support growth.
Market sell-offs are unsettling and uncomfortable, but they are not uncommon. Over the last 20 or so years, global equities have witnessed about one of these types of sell-offs every 2 years.
Despite being behind the wheel of a Tesla, it may be some time before President Trump looks to puts the brakes on the US stock market sell-off as he’d much rather the US Federal Reserve step in with lower interest rates (which will ease his debt burden!). Regardless, lower prices will tempt cash investors back in as technical opportunities present themselves.
Much of this recent sell-off has been concentrated in richly valued US technology stocks. These stocks constituted a high weight within broad passive indices. We have some exposure to these names within our clients’ portfolios but at a relatively low weighting and have diversified our clients’ equity exposure via relatively high exposure to the UK market (which we increased towards the back end of last year), defensive assets such as infrastructure and defensive equity sectors such as consumer staples.
History tells us that being overly reactive in these environments can cause damage to long-run returns. We intend to use market volatility as a friend and to keep diversified and to keep invested.
[1] These companies comprise Apple, Microsoft, Alphabet, Meta, Nvidia and Tesla.
[2] From the period 17th December to 11th March in GBP
[3] Using Bloomberg data at 12/3/25.
[4] As per data from the St Louis Fed
[5] e.g. crossing through its 200 day moving average level and breaking through the lower bound of its relative strength indicator at 11/3/25.
[6] Press Conference in August 2024
[7] US CPI released on 12th March
[8] Source Bloomberg. As at 13.3.25
The value of investments and the income from them can go down as well as up and you could get back less than you invested. Past performance is not a reliable indicator of future performance.
The content of this article is not intended to be or does not constitute investment research as defined by the Financial Conduct Authority. The content should also not be relied upon when making investment decisions, and at no point should the information be treated as specific advice. The article has no regard for the specific investment objectives, financial situation or needs of any specific client, person, or entity.